I know a founder who was working eighty hours a week and believed he was winning.
His P&L showed profit every month. His cash balance was growing. He had a product people wanted, a growing customer base, and the kind of momentum that makes you feel like you’re finally figuring this thing out. But he couldn’t step away from the business for a week without it stalling. He couldn’t afford to hire anyone meaningful. And every time he tried to model what growth actually looked like, the math got murky in ways he couldn’t explain.
When we sat down together and I asked him how he accounted for his own time, he looked at me like I’d asked him to solve a physics problem.
He hadn’t. Not formally, not anywhere in the P&L. He was shipping product, handling customer service, managing the supply chain, and personally assembling components at a pace that would have cost him $80,000 or more per year to replace. That cost lived nowhere in his books. His gross margin wasn’t real. His profit wasn’t profit. It was wages he’d forgotten to pay himself.
This is the most common margin blind spot I encounter: the business looks healthy until you price the thing that’s holding it together. Once we rebuilt his unit economics with a realistic cost for his time, the picture changed entirely. The margin that looked like 60% was closer to 30%, and that’s before we got to customer acquisition costs, shipping, or discounting.
He wasn’t running a profitable business. He was running an elaborate mechanism that converted his labor into cash, and mistaking the output for a return.
This is the third article in the Levers for Growth series. In Lever One: The Sales Engine, we built the framework for understanding customer acquisition economics: CAC, LTV, SER, and what it actually costs to generate a dollar of revenue. In Lever Two: Working Capital, we looked at how cash moves through a product business and how to stop it from getting trapped in your inventory.
Both of those frameworks depend on one thing being true: that your margin numbers are real.
Most of the time, they aren’t. Not in the way founders think. And that’s what this article is about: how e-commerce profit margins get misread, where contribution margin tells a truer story, and what to do about it.
What Gross Margin Is Actually Telling You
Gross margin is the first number most founders learn to track. It’s the percentage of revenue left after you subtract the direct cost of the product. Simple in theory, chronically misleading in practice.
The formula isn’t complicated:
Gross Margin = (Revenue - COGS) / Revenue

Example:
Revenue:  $100
COGS:     $25 (materials, manufacturing)
Gross Margin: 75%
But here’s what that number doesn’t tell you: how much it actually costs to sell that product and get cash in the bank. Once you add shipping, discounts, returns, customer acquisition, and any labor that didn’t make it into your COGS calculation, the story changes fast.
The framework I use with partners is contribution margin: a cleaner signal for what a product or channel actually contributes to covering your overhead and generating real profit.
Contribution Margin = Revenue - Variable Costs of Selling
Variable Costs include:
- Product cost (COGS)
- Discounts and promotions
- Shipping to customer
- Returns and restocking
- Channel fees (Amazon, Shopify, marketplace fees)
- Direct marketing / customer acquisition cost (CAC)
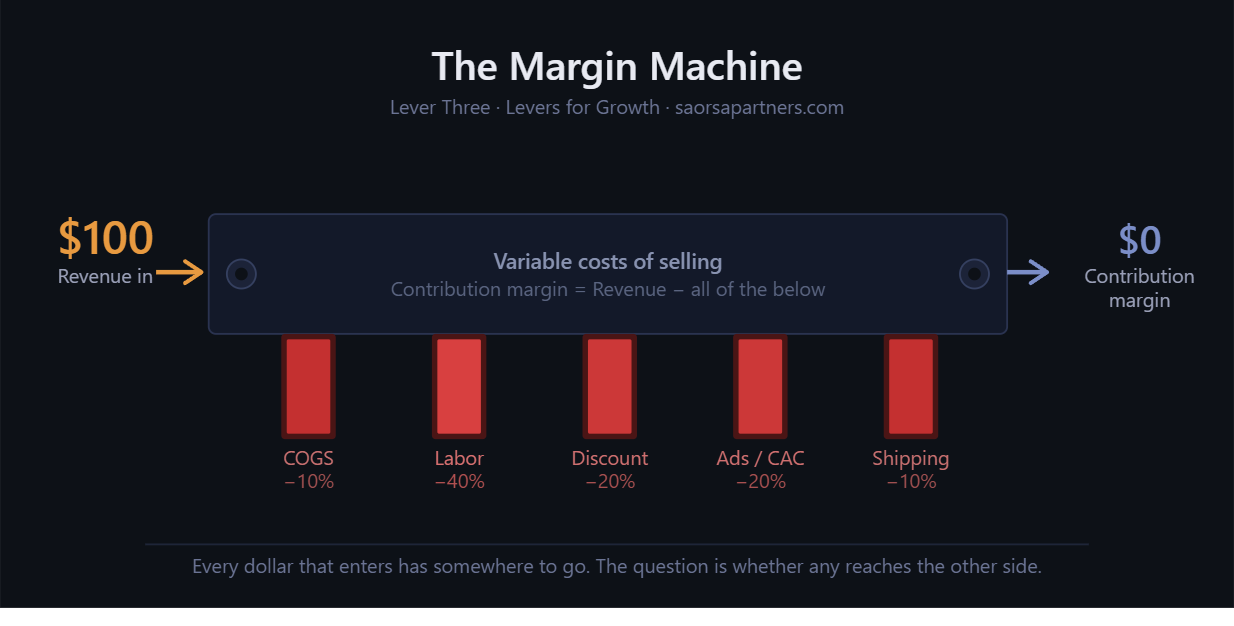
- Unattributed labor (founder time, assembly, fulfillment)Let’s run the full waterfall on a real-looking example — the kind of unit economics I see more often than I’d like:
Revenue:                           $100.00    (100%)
Materials / COGS:                  -$10.00    (10%)
  Reported Gross Margin:            $90.00    (90%)

Unattributed founder labor:        -$40.00    (40%)
Promotional discount:              -$20.00    (20%)
Customer acquisition (digital ads): -$20.00   (20%)
Outbound shipping:                 -$10.00    (10%)

  True Contribution Margin:          $0.00    (0%)
Zero. The business is moving money, but it isn’t making any.
The founder sees 90% gross margin on his P&L and feels good. The cash balance is growing because he’s effectively getting paid, but only in revenue, not in profit. The moment he tries to hire someone to replace his labor, the model falls apart. The moment he stops running ads, revenue disappears. He’s not building equity. He’s treading water in a suit that looks like a life jacket.
This is why gross margin, on its own, is a dangerous number to trust. It measures cost of production. Contribution margin measures cost of selling, this is the number that determines whether your business model works.
The Mindset Shift: You Sell to the Customer, Not the Product
One of the most powerful unlocks I’ve seen with an early-stage product business came not from a pricing change or a cost reduction, but from a reframing of what the business was actually selling.
The company made protective components for dirtbikes — specifically swingarm guards. Their instinct was to expand horizontally: more guard designs, more bike models, broader catalog. More SKUs to serve more customers. Standard growth playbook.
The problem with that instinct, when you look at the contribution margin math, is that it treats each product as its own independent profit event. Acquire a customer for $25, sell them a product with $75 of gross margin, net $50. Repeat.
What we found when we mapped the economics more carefully was that the real opportunity wasn’t in reaching new customers — it was in selling more to the ones they already had. A customer who had already purchased once could be sold a second product, a third, a fourth. The $25 acquisition cost didn’t repeat. The margin on order two was almost entirely additive.
Here’s how the contribution margin evolved across three stages:
Stage 1 — Broad catalog, single SKU per customer:
  Unit cost:       40% of revenue
  Cost to sell:    25% of revenue
  CM:              35%

Stage 2 — KTM-focused pivot, multi-product cart:
  Unit cost:       45% of revenue (new products, supply chain still being optimized)
  Cost to sell:    10% of revenue (CAC amortized across multiple SKUs)
  CM:              45%

Stage 3 — Supply chain dialed in, existing customer base:
  Unit cost:       25% of revenue
  Cost to sell:    10% of revenue
  CM:              65%
The shift from Stage 1 to Stage 3 wasn’t magic. It came from a strategic decision to narrow the focus — double down on one customer type (KTM riders) and build enough product depth to make that customer worth $200 of gross margin instead of $100, while paying the same $25 to acquire them. That’s the economics of a real business, not just a product.
The framing that unlocked this: we’re not selling products. We’re selling to a customer. Once the business accepted that, the growth priorities became obvious. Product development for the existing customer base, not lateral expansion to new markets with smaller addressable audiences and higher acquisition friction.
When you think about it this way, contribution margin by customer becomes as important as contribution margin by SKU. And your Sales Engine, which we built in Lever One, starts to look very different when LTV is expanding not through retention alone, but through wallet share.
What Amazon Is Actually Costing You
Channel economics is where I most often find hidden margin destruction — and the channel that surprises founders most is Amazon.
Amazon is seductive. It offers traffic, trust, and Prime shipping infrastructure you’d never replicate on your own. For many products, it’s legitimately the right channel. But the fee structure is one of the most aggressive in e-commerce, and it’s easy to miss how much it’s actually taking.
Here’s roughly what Amazon FBA costs look like when you stack the full picture:
Revenue (your selling price):          $100.00
Referral fee (avg ~15%):               -$15.00
FBA fulfillment fee:                    -$5.00
Storage fees (varies):                  -$2.00
Inbound placement / misc fees:          -$3.00

Platform fees before product cost:     -$25.00   (25% of revenue)

With advertising (Amazon PPC, common):  -$15.00

Total cost to sell on Amazon:          -$40.00   (40% of revenue)
Those numbers aren’t unusual. Industry benchmarks consistently put total Amazon FBA selling costs — platform fees plus advertising — in the 35-40% range for standard product categories.
Now look at what that does to a business that also sells DTC:
                    DTC (Shopify)       Amazon FBA
Revenue:             $100               $100
Gross Margin:         80%                80%
Post-discount GM:     70%                70%
Cost to sell:         20%                40%
Contribution Margin:  50%                30%
If this business is reporting a blended 40% contribution margin and feeling fine about it, the channel breakdown tells a different story. DTC is generating real profit. Amazon is generating revenue that looks like profit but is quietly consuming cash on every order.
I worked with a client who had Amazon running at roughly 30% of total revenue — a number the team was proud of. When we broke out the channel economics, Amazon was contributing about 5% of total gross margin dollars despite generating nearly a third of the top line. The math was simple: every Amazon order was costing them more to sell than their DTC orders, and the volume amplified the drag.
We killed the channel. Revenue dropped. Margin improved substantially. And the team was able to redirect the energy spent managing FBA inventory, listings, and customer service disputes toward the channel that was actually building the business.
This isn’t an argument against Amazon. It’s an argument for knowing what Amazon is actually costing you before you scale it.
The Accounting Problem No One Talks About
Here’s a practical issue that sits underneath everything else in this article: most founders don’t have the accounting infrastructure to see their margins clearly in the first place.
The most common problem I encounter when onboarding a new partner is cash-basis bookkeeping applied to an inventory-based business. In cash-basis accounting, your cost of goods recognized is based on when you write the check to your supplier — not when the product sells. The result looks like this:
Month 1 (receive inventory, pay supplier):
  Revenue:    $50,000
  COGS:      -$80,000  (paid for 3 months of inventory)
  Gross Margin: -60%   ← meaningless

Month 3 (selling from inventory, no new purchases):
  Revenue:    $70,000
  COGS:       -$5,000  (small reorder)
  Gross Margin: 93%    ← also meaningless
Neither number reflects reality. Blended over three months, the average might look reasonable, but month-to-month you have no idea whether your margins are improving or deteriorating. You can’t make decisions from that signal. You certainly can’t build a reliable financial model from it.
Accrual accounting, specifically matching cost of goods to the revenue it generates when inventory is sold, is the foundation that makes everything else in this series possible. Without it, your contribution margin analysis is guesswork, your channel comparisons are approximate, and your working capital decisions (Lever Two) are based on inventory values that don’t reflect what’s actually moving.
This isn’t an advanced CFO problem. It’s step one. And if your accounting setup isn’t there yet, the single highest-leverage thing you can do for your business right now is fix it. If you’re not sure where to start, reach out and I’m happy to connect you with an e-commerce accounting firm that can get you set up properly —duncan@saorsapartners.com.
Common Patterns I See in $2-20M E-Commerce Businesses
The markup mentality. Most founders I work with were taught to price as a multiple of cost: 4x, 5x, 10x. The problem with markup-based pricing is that the math obscures what actually matters. A 5x markup means your COGS are 20% of revenue. But does that account for the returns rate? The channel fees? The discount you’re running on the site? Thinking in gross margin terms, cost as a percentage of revenue, keeps the math honest as your cost structure evolves and is the standard that ties to your financial model and inventory valuation. The moment you make a pricing decision using a markup multiple, you’ve disconnected from the number your P&L actually reports.
All channels are not created equal. This one takes founders by surprise more than almost anything else. They’ve been running DTC and Amazon side by side, assuming the diversification is healthy. When we break out the cost of selling by channel, there’s almost always a meaningful gap: one channel is generating real contribution margin, another is generating revenue that barely covers its own acquisition cost. The response I hear most often is some version of “but Amazon is 30% of our revenue.” That’s the wrong number to anchor on. Revenue without margin isn’t an asset.
Marketing spend treated as fixed overhead. I see this constantly: a monthly marketing budget described as “that’s just what we spend.” $4,000 a month on digital ads, loosely attributed to “brand awareness,” with no clear connection to orders generated. The fix is simple. Break it into an effective cost-per-order by channel and stack that against your contribution margin to determine whether that spend is actually profitable. It’s not complicated. It’s just that nobody’s done it. Once you have that number, every marketing conversation changes.
Disorganized or cash-basis accounting. Already covered above, but worth repeating: if you can’t see your COGS on an accrual basis by SKU, you are operating on intuition, not information. The founders who understand their inventory by counting pallets and checking the bank balance are not wrong to do so — but that visibility ends at “do we have product” and “do we have cash.” It tells you nothing about margin.
CEO Q&A
My gross margin looks strong — 70% blended. Should I be worried?
Maybe. The first question I’d ask back is: what’s in your COGS calculation? If you’re not accruing inventory on a per-unit-sold basis, that 70% might be an artifact of your billing cycle, not your actual economics. The second question is whether you’ve priced your own time. The third is whether that 70% is consistent across channels, SKUs, and customer segments, or whether it’s a blend that’s hiding something weaker underneath.
I’m thinking about cutting a product that isn’t hitting our markup target. Is that the right call?
Maybe not. I was in a leadership meeting where a CEO was about to discontinue a product because it couldn’t hit a 10x markup target. The product was at 7.5x. When we translated that into gross margin terms, the difference was about 3 percentage points, genuinely not material to the business. The decision was about to be made on the wrong metric entirely. Before cutting a SKU, run the actual contribution margin waterfall. Markup multiples are a rough heuristic, not a profitability verdict.
We have a product that drives most of our revenue. How do I know if it’s actually our best product?
Revenue rank and contribution margin rank are often different lists. A high-volume SKU with a steep promotional discount, a meaningful return rate, and significant fulfillment complexity can consume far more of your time and margin than its revenue share suggests. Run the full cost-of-selling waterfall on your top three products by revenue and see whether the ranking holds. Often it doesn’t.
All channels feel important. How do I decide where to focus?
Calculate the contribution margin on each channel independently. Stack up revenue, then subtract COGS, channel fees, platform costs, and the direct marketing spend attributable to that channel. What’s left is the contribution. Then ask: if I doubled the volume in each channel, which one would create the most value? Usually the answer becomes obvious, and it’s rarely the channel generating the most revenue.
I don’t have time to build fancy financial models. What’s the minimum I should track?
Five numbers: contribution margin by channel, cost-per-order by marketing channel, days of inventory on hand by SKU, cash balance, and outstanding payables. That’s not a financial model. That’s a Monday morning scorecard. If you’re tracking those five things weekly with any discipline, you’ll catch problems before they compound. We’ll go deeper on this in Lever Eight.
If you want help building the next layer — connecting those five numbers into a forecast you can actually run decisions through — that’s the work I do with partners. Reach out at duncan@saorsapartners.com.
When is a discount strategy actually worth it?
When it either clears aged inventory that would otherwise cost you storage or write-down, or when the LTV of the acquired customer is measurably higher than the contribution you gave up. A 20% discount on a product with a 30% contribution margin means you’re essentially paying the customer to take your product. That can make sense as a new-customer acquisition mechanism if you have strong retention data showing repeat orders. It almost never makes sense as a permanent site-wide discount, which is effectively a permanent price reduction you’ve normalized in your customers’ expectations.
My accountant says our margins look fine. Why are you telling me to re-examine them?
Your accountant is probably doing their job correctly within the scope they’ve been given. Most small business accountants are set up for tax compliance, not operational decision-making. The questions I’m raising, contribution by channel, unattributed labor in COGS, accrual-basis inventory matching, are operational accounting questions that require a layer of analysis beyond a standard monthly close. It’s not a criticism of your accountant. It’s a scope question and if your books are set up to handle tax obligations and produce a P&L, that’s necessary but not sufficient for the kind of decisions this series is asking you to make.
What’s Coming in Lever Four
Once you can see your margins clearly, by SKU, by channel, by customer type, the next question is obvious: what’s this business going to look like in six months? In twelve?
Lever Four is about forecasting. Not the fantasy spreadsheet you built in January that hasn’t been touched since. A driver-based model that starts with the inputs your Sales Engine generates (traffic, conversion, AOV, reorder rate) and flows them through your margin structure, cashflow dynamics, and working capital cycle to produce something you can actually make investment decisions from.
We’ll also get into why the goal of a financial model isn’t to be right. It’s to be less wrong, faster. And how your margin structure, the framework we’ve covered here, changes your working capital assumptions in ways most founders don’t see coming.
Duncan Young is the founder of Saorsa Growth Partners, a fractional CFO firm serving e-commerce and inventory-based businesses doing $2-20M in revenue.